


The Graph API Request Anatomy
- Jul 3
- 8 min read
Graph API in Entra ID — Article 1
That Microsoft Doesn't Draw for You
You've made ten thousand Graph API calls. You've memorized GET https://graph.microsoft.com/v1.0/users. You can write an OAuth token acquisition flow in your sleep.
But do you know what actually happens after you press Send?
Not the HTTP response. The infrastructure between your request and the Entra ID directory that decides whether you get fresh data, stale data, or a 429 Too Many Requests at 2 AM during a production sync.
This article is the one I wish someone had written before I spent a weekend debugging why a PATCH on a user object, immediately followed by a GET, returned the old value. The answer has nothing to do with code. It has everything to do with replica architecture, logical sessions, and a consistency model that most developers never think about — until it bites.
What the Docs Show vs. What Actually Happens
Every Microsoft Graph tutorial draws the same picture: your app makes a REST call to graph.microsoft.com, gets a JSON response, and moves on. That picture is like showing someone a photograph of a restaurant's front door and calling it a cooking lesson.
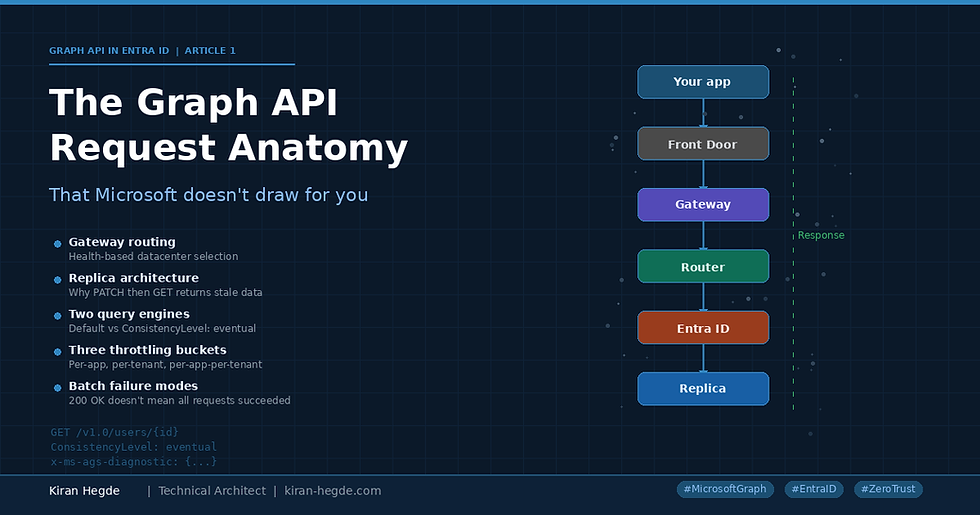
The Real Path: App → Azure Front Door → Graph Gateway → Health Probes → Workload Router → Backend Service → Directory Partition → Replica → Response Assembly → App
Each of those layers makes decisions that affect your data's freshness, your request's latency, and whether you hit throttling. Let's walk through them from the architect's perspective.
Layer 1: The Gateway and Health-Based Routing
The Graph Gateway Service sits behind Azure Front Door and does more than load balancing. It runs continuous transactional health probes against backend servers and dynamically reroutes traffic to healthy datacenters when problems are detected.
Why this matters architecturally: your Graph API traffic can be served from different datacenters across different calls in the same session. The routing is health-based, not geography-locked (with some exceptions for sovereign clouds).
The x-ms-ags-diagnostic response header reveals the actual datacenter, slice, ring, scale unit, and role instance serving each request. During an incident, watching this header drift across datacenters tells you the Gateway is rerouting — and that's by design, not a bug.
x-ms-ags-diagnostic: {
  "ServerInfo": {
    "DataCenter": "UK South",
    "Slice": "E",
    "Ring": "5",
    "ScaleUnit": "007",
    "RoleInstance": "LO1PEPF0000496F"
  }
}
💡 Architect's Tip: Capture this header in your logging. When production breaks, it's the first breadcrumb.
Layer 2: The Workload Router — One Endpoint, Many Backends
The unified graph.microsoft.com endpoint is a facade. Behind it, your request is routed to the specific workload backend that owns the resource: /users routes to Entra ID, /me/messages routes to Exchange Online, /teams routes to the Teams backend.
This invisible routing has three consequences that matter:
Consequence 1: Throttling is per-workload
A burst of calls to /users consumes your Entra ID quota but doesn't touch your Exchange quota. You can be throttled on /me/messages while /users calls sail through. Each workload has its own throttling bucket with its own limits and its own cost-per-request model.
Consequence 2: Consistency models vary by workload
The Entra ID directory has a specific replica-based consistency model (which we'll dig into next). Exchange has a different one. SharePoint has yet another. When you see stale data from Graph, the root cause depends on which workload is serving the response.
Consequence 3: Feature availability diverges
Not all OData query parameters work the same across workloads. The $filter operator behaves differently on /users (Entra ID) than on /messages (Exchange). The $search parameter uses different search indexes. This isn't a bug — it's a consequence of routing to different backend systems through a single URL namespace.
Layer 3: The Entra ID Replica Architecture — Where Stale Reads Are Born
This is where most architects' mental model breaks down, and where the most subtle production bugs hide.
Microsoft Entra ID's directory data is organized into partitions. Each partition has one primary replica and multiple secondary replicas distributed across geographically separated datacenters.
Writes always go to the primary replica
When you PATCH /users/{id} to update a display name, that write is routed to the primary replica for the partition that owns that user. The write is synchronously replicated to at least one secondary replica in a different datacenter before the API returns success. This gives you geo-redundant durability — if the primary datacenter goes down immediately after your write, the data survives.
Reads are served from secondary replicas
When you GET /users/{id}, the request is served from a secondary replica, typically the one closest to your geographic location. Secondary replicas are in an active-active configuration across multiple datacenters.
Asynchronous replication creates a consistency gap
While the initial write is synchronously replicated to at least one secondary, replication to all other secondaries is asynchronous. This means a PATCH followed by an immediate GET can return stale data — if the GET is served by a secondary that hasn't received the replication yet.
⚠️ This is the "read-after-write" problem — the #1 source of confusion for developers building on Graph API for the first time.
Layer 4: Logical Sessions and the Replica Token
Microsoft doesn't leave you completely at the mercy of eventual consistency for default queries. The Graph API service maintains a logical session to provide read-after-write consistency within the same session.
How it works:
1. Your first request to Graph establishes a logical session with affinity to a specific secondary replica.
2. The Graph service caches a replica token — a pointer to which secondary replica is serving your session — in a distributed cache within the secondary replica's datacenter.
3. Subsequent requests in the same logical session are routed to the same secondary replica, so you get consistency within your session.
Key Insight: The replica token provides read-your-own-writes consistency WITHIN a single logical session, NOT across sessions. If App A writes a user update and App B immediately reads that user, App B may see stale data because it has a different logical session on a different secondary replica.
Critical constraint: to continue using the same logical session, subsequent requests must be routed to the same Entra datacenter. If requests start going to different datacenters (failovers, load rebalancing, multiple client instances), the logical session breaks.
Patterns for cross-service consistency:
Wait and verify: After a write, poll with a short backoff until the read returns the expected value. Crude but reliable.
Carry forward: After a write, carry the written value in your application state rather than reading it back. Only read from Graph on the next natural refresh cycle.
Use webhooks: Subscribe to change notifications so you're told when the write has propagated, rather than polling for it.
Layer 5: The Two Query Engines You Didn't Know You Were Choosing Between
Here's something the documentation buries across thirty different pages: Microsoft Graph's Entra ID workload has two separate query engines backed by two separate index stores, and the ConsistencyLevel: eventual header is the switch between them.
Engine 1: The Rest Directory Service (default)
Standard queries without the ConsistencyLevel header hit the primary directory store. This engine supports basic $filter operations, returns strongly consistent results within your logical session, and is optimized for common access patterns.
Engine 2: The Advanced Queries Service
When you add ConsistencyLevel: eventual and $count=true, your request routes to a separate index store. This supports additional operators: not, ne (not equals), endsWith, and $search.
But there's a cost:
• Reads may return data slightly behind the primary replica's current state
• The query is more expensive — it routes through a consistency-checked path instead of a lightweight read cache
• Each request consumes more CPU, I/O, and memory on Microsoft's backend
• These requests are more likely to trigger throttling
🚫 Don't add ConsistencyLevel: eventual as a habit "just in case." It costs more AND returns less-fresh data. Choose deliberately.
The Throttling Architecture: Three Buckets, First One Wins
Every request is evaluated against multiple throttling limits simultaneously. The first limit reached triggers the 429 response.
Dimension | Scope | What It Means |
Per app across all tenants | Global | Your multi-tenant app's total load across all customer tenants |
Per tenant for all apps | Tenant-wide | Combined load from ALL apps in a single tenant |
Per app per tenant | Intersection | Your app's load in one specific tenant (capped at 50% of tenant limit since Sep 2025) |
Beyond these three dimensions, different workloads have completely different throttling budgets:
Workload | Limit | Notes |
Identity & Access | Resource unit cost model | GET on users costs ~2 units; writes cost more |
Excel APIs | 5,000 req / 10 sec / app | Across all tenants |
Teams messaging | 4 req / sec / tenant | Channel messages only |
Intune | 2,000 req / 20 sec tenant-wide | Only 100 available for writes |
Presence | 10,000 req / 30 sec / app / tenant | Recently increased from 1,500 |
⚠️ The Retry-After header isn't always present on 429 responses. Your retry logic must implement exponential backoff with jitter as the default.
Batch Requests: Performance Multiplier with Hidden Failure Modes
The POST /$batch endpoint combines up to 20 requests into a single HTTP call. This can reduce execution time from 50 seconds to 11 seconds for the same operations. But batching introduces failure modes that don't exist in individual requests.
Failure Mode 1: Partial failure
A batch returns 200 OK if the JSON payload was parsed correctly. But individual requests inside can fail independently. Request #3 might return 200, while request #7 returns 429, and request #12 returns 404. If your code only checks the outer 200 status, you're silently losing operations.
{
  "responses": [
    { "id": "1", "status": 200, "body": { "displayName": "..." } },
    { "id": "2", "status": 429, "body": { "error": { "code": "TooManyRequests" } } },
    { "id": "3", "status": 200, "body": { "displayName": "..." } }
  ]
}
Failure Mode 2: Individual throttling within a batch
Each request inside a batch is evaluated individually against throttling limits. You can have 15 succeed while 5 are throttled. The batch isn't atomic — it's a convenience for network optimization, not a transaction.
Failure Mode 3: Mixed API versions
You cannot combine v1.0 and beta endpoint requests in the same batch. A beta-only endpoint sent to the v1.0/$batch URL will fail with 405 while the rest succeed.
Failure Mode 4: Payload size
Total batch payload is limited to approximately 4 MB. For bulk operations with large request bodies, you may hit this limit before reaching the 20-request cap.
✅ Always iterate through every individual response in a batch. Queue failed items for retry. Never treat a batch as all-or-nothing.
Architect's Decision Framework
Decision 1: Consistency Requirements
Scenario | Pattern | Why |
Write then read in same app | Carry forward — use written value from memory | Logical session helps, but "eventual" can mean seconds |
Write from App A, read from App B | Webhook or polling with backoff | Different sessions = different replicas. No guarantee. |
Complex search with endsWith, ne, not | ConsistencyLevel: eventual + $count=true | Accept results may lag by seconds. Design UI accordingly. |
Auth/authorization check | Default (no ConsistencyLevel header) | Standard engine is optimized for this. |
Decision 2: Throttling Strategy
App Type | Strategy |
Single-tenant internal tool | Simple retry with exponential backoff |
Multi-tenant SaaS | Per-tenant token bucket + global circuit breaker |
Bulk sync job (50K users) | Pre-calculated request budget + batching + queue |
Event-driven processing | Webhook trigger + delta query reconciliation |
Decision 3: Diagnostic Headers to Log
Header | What It Tells You |
x-ms-ags-diagnostic | Datacenter, scale unit, server instance serving the request |
request-id | Microsoft's correlation ID — critical for support tickets |
client-request-id | Your correlation ID echoed back — match to your app logs |
Retry-After | Seconds to wait on 429 (when present) |
x-ms-resource-unit | Resource unit cost charged — helps predict throttling |
Five Questions Before Your Next Architecture Review
1. Which workloads am I touching? Map every Graph API call to its backend. Each has different consistency models, throttling budgets, and query capabilities.
2. What are my consistency requirements? Cross-service and cross-instance consistency requires explicit design — webhooks, delta queries, or carry-forward patterns.
3. What's my request budget? Calculate total Graph API calls at peak load. Compare against per-workload throttling limits. If the math doesn't work, you need caching, batching, or architectural changes — not hope.
4. How do I handle partial failure? Every layer can fail independently. Your error handling should be as distributed as the infrastructure.
5. What am I logging? Capture the diagnostic headers. Build dashboards on throttle rates, response latencies by workload, and datacenter distribution. The infrastructure is telling you how it's performing — listen.
This is Article 1 of the "Graph API in Entra ID" series. Next: "Permission Architecture — Why Your Graph App Is Over-Privileged (And How to Fix It)."
Published on kiran-hegde.com | Connect on LinkedIn
Comments